Category: Design
-
Essential Tips for WordPress Admins and Editors
(This post supposes that you have a working WordPress site already and now want to improve the content and design for the site.) You’ll first need a login for your WordPress site. The login is most probably at example.com/wp-login. Most articles on “Getting started with WordPress” begin with setting up WordPress on a server, or…
-
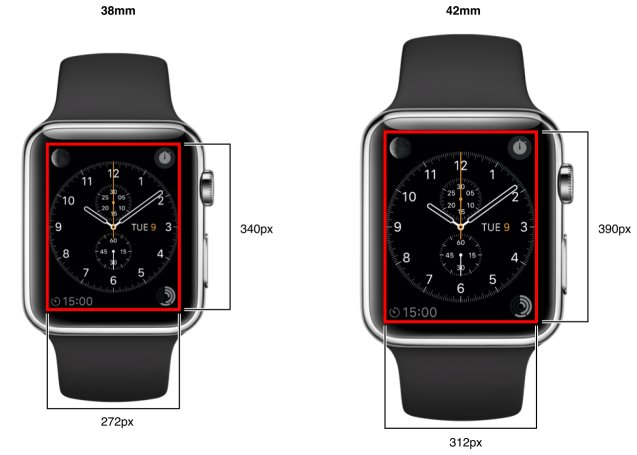
Designing the Apple Watch UI – a quick guide
The Apple Watch is releasing in a month! Here’s a list of important things you need to know, if you’re interested in designing or developing an Apple Watch App: 1. Layout and Screen Sizes 38mm: 340 pixels x 272 pixels 42mm: 390 pixels x 312 pixels That’s an aspect ratio of 4:5. 2. Icon…
-
Native Vs Hybrid Mobile Apps
I was recently checking how the Hybrid App frameworks compare to Native iOS or Android Apps. Here are my observations on few Phonegap Apps that I tried on my phone: The size of Phonegap Apps is big: an app that should have been less than 10MB has a 40-50MB installer. The Apps take longer to…
-
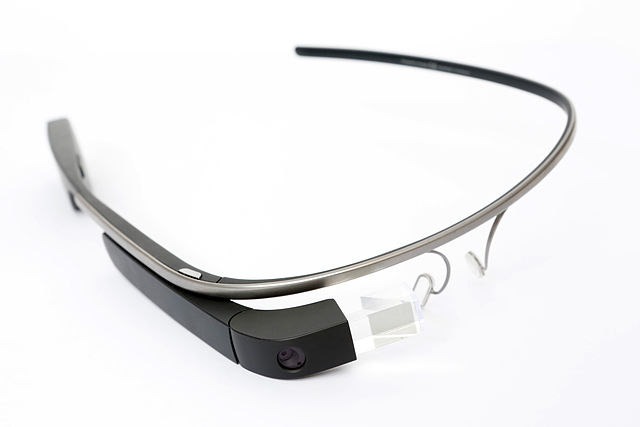
What’s inside Google Glass?
It’s impressive to see how much punch “Google Glass” packs in an elegant and light-weight construction. (Image: iFixit) I’ve long believed that the ability to create new materials is a good indicator of a country’s production and economic ability. Just look at what Britain, US and Germany did with materials during the industrial revolution and…
-
Visualizing data using graphs and charts
There’s been a surge in reporting data using charts on the web. This has brought in the trend of infographics and several tools (JS libraries) that simplify the task of drawing charts. Many people get too occupied in visual design and overlook whether the chart actually fits their use case though. Software charting libraries/plugins ought to…
-
Redesigning Windows desktop theme with Rainmeter
One thing I miss about the Windows OS is the nifty selection of desktop applications developed by some amazing people over the years. Macs were too closed and expensive when I started working with computers. While, Windows and Linux gave me an opportunity to dissect my PC and play around with installing different OSes. An…
-
Turn the volume down
Jan 18, 2010 Reposting comments from a discussion about earphones on slashdot — Re:Turn down the volume (Score:4, Interesting) by Khyber No, your ear drums are not a nerve. They’re a tympanic membrane. Where you lose your hearing is from the loss and the degradation of the three inner ear bones caused by intense sound…
-
The Art of Engineering
Ever given a curious thought to what happens when that 220 Volts is plugged into the computer? Here goes: A basic circuit converts the 220V AC to a 5V DC and feeds it to the Oscillator on the MotherBoard. A wave of electrical pulses that flips about 109 (1000,000,000) times a second is generated. For…
-
Electric Emotions.
Sep 30, 2009 You never compromised. Why should anything be less than perfect. The things you loved to do, you couldn’t. And still been there, done that. Who was it that you actually cared for. Who got sidelined. How many have you left behind — when they wanted you — and then the order reversed.…