Category: General
-
India’s New Education Policy (NEP 2020) — Key Points
(Cross-post from schooldesk.io) A New Education Policy (NEP) for India was approved by the Union Cabinet on 29 July 2020. The policy is forward-looking, inclusive, the right amount of idealistic, and very much doable. There are big changes to the current system in this policy and these are being received very positively by most people,…
-
Quick Monitor Buying Guide
Deciding the screen size You ought to consider the right physical size in inches with the screen resolution — deviating too much from the following chart would either make the screen too pixelated or you might find the default font size to be too small.
-
Product Analytics for growing Startups
For any product company, understanding how their product performs is crucial in achieving growth. And data-driven decision-making can uncover hidden patterns and help align the products with its long-term vision. The Amazons and Googles of the world are successful because they have successfully used analytics at key stages of their product lifecycles. Now of course…
-
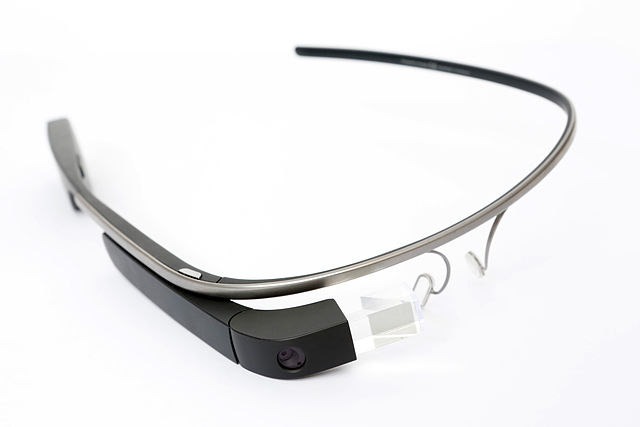
What’s inside Google Glass?
It’s impressive to see how much punch “Google Glass” packs in an elegant and light-weight construction. (Image: iFixit) I’ve long believed that the ability to create new materials is a good indicator of a country’s production and economic ability. Just look at what Britain, US and Germany did with materials during the industrial revolution and…
-
The Signal and the Noise by Nate Silver
Just finished reading this book and would whole-heartedly recommend it. A very engaging read for anyone interested in Statistics, Data Analytics and Predictions. “Nate Silver is a statistician, writer, and founder of The New York Times political blog FiveThirtyEight.com. He was named one of the world’s 100 Most Influential People by Time magazine.” He predicted the results of last…
-
Tips to boost performance of a Windows PC
I recently dived into fixing some of my PC nagging performance issues. Two years of use called for an overhaul! Here are some tips and tricks I used to fix the issues: 1. Use System Logs to identify the most critical issues that slow down your PC a) Open “Event Viewer” b) Goto ‘Application and…
-
Redesigning Windows desktop theme with Rainmeter
One thing I miss about the Windows OS is the nifty selection of desktop applications developed by some amazing people over the years. Macs were too closed and expensive when I started working with computers. While, Windows and Linux gave me an opportunity to dissect my PC and play around with installing different OSes. An…
-
The new Nao is awesome!
Dec 13, 2011
-

Aero India 2011
Hot day, a huge crowd, and most people would have gotten back exhausted. The arrangements at AeroIndia could have been better. But props to those who attended. Open-air fields are rough. What doesn’t kill you makes you stronger haha. Nevertheless, I did enjoy many things at the show — I had to. I can’t hate…